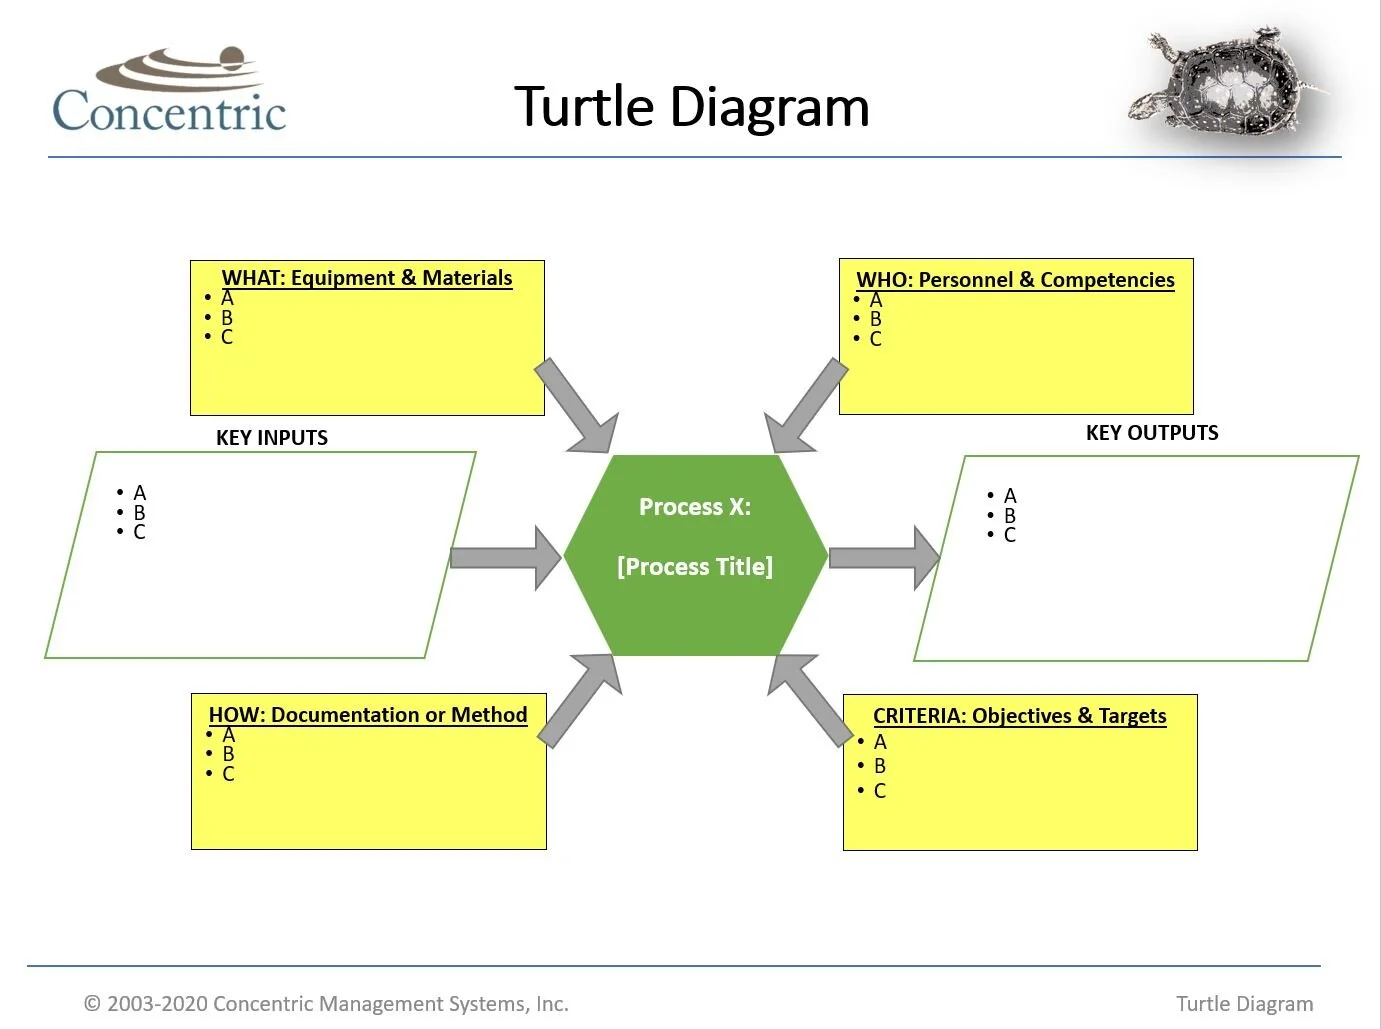
A "Turtle Diagram" is a quality tool used to visually display process characteristics such as inputs, outputs (expectations), criteria (metrics) and other high-level information to assist in the effective execution and improvement of key business processes.
Read More


